Doing Cluster Level Metric Calculations Using Super Metrics and Custom Groups
In this article, we will look at how to use Super Metrics and Custom Object Groups to do a Cluster Level calculation in VMware vRealize Operations Manager 7.0.
Introduction
Consider the following use case. You want to identify a metric for a given vSphere Cluster. That metric can, for example, be Average CPU Usage (cpu|usage_average) or remaining capacity (based on hardware|memorySize) coming from the new VMware vRealize Operations (vROps) capacity analytics engine.
However, you may discover that the calculation of those metrics for the cluster does not take into account and adjust when a host is put into maintenance mode, or if the host is powered off or unreachable from vCenter. While there is a reasoning behind this, the decision to do so may not sit well with everybody and satisfy all use cases. The assumption is that, for example, Maintenance Mode is not done forever. This is supposed to be a datacenter activity which should have a short lifespan. Having this said, the behavior then should cover the majority of customer cases.
Let’s see what we can do for the minority of customers that do not want hosts in Maintenance Mode or disconnected/unreachable hosts to be included in those calculations.
Using Super Metrics and Custom Object Groups
The first thing we need to do is to look into vROps Super Metrics.
A Super Metric is an administrator created a custom metric based on a mathematical formula from existing metrics that can then be applied via policy. A Super Metric can be derived from either a single object or multiple objects across multiple environments.
The easiest way is to imagine a super metric is as a spreadsheet formula or cell. vRealize Operations offers a worksheet-like environment where you can combine existing metrics for an object in a formula to create a new one: a super metric. This metric can then be attached to an object and data collected like any other object. You can of course also visualize them in a dashboard, view or report. Super metrics can be used to calculate averages, percentages, sums, min and max, among others.
Let’s take for example the following Microsoft Excel spreadsheet

As you can see in the spreadsheet we have our normal CPU Ready % showing the current CPU ready time for each VM in a payload cluster. If we want to calculate the Average CPU Ready % time for a VM for a given period (a day of the week or weeks average) we can use the AVERAGE excel cell formula which can calculate that value for us. We can say that each of the cells representing that average value is Super Metric-like cells in excel.
With the introduction of vRops 6.3, and the new super metrics operators, it is now it is even easier to transform or create new metrics from the already collected metrics. New operators are as following:
| Operators | Function | Example |
| [] | Array | [A, B, C] |
| == | Equal | 1==1 |
| != | Not equal | 1!=2 |
| < | Less than | 1<2 |
| <= | Less than or equal | 1<=2 |
| > | Greater than | 2>1 |
| >= | Greater than or equal | 2=>1 |
| || | Or | |
| && | And | |
| ? : | If then else | A ? B : C |
| ! | Not | !(1>2) |
| Where | Where | 1==1 where = “==1” |
INFO: For more about how Super Metrics work you can check the book, Mastering vRealize Operations Manager – 2nd Edition
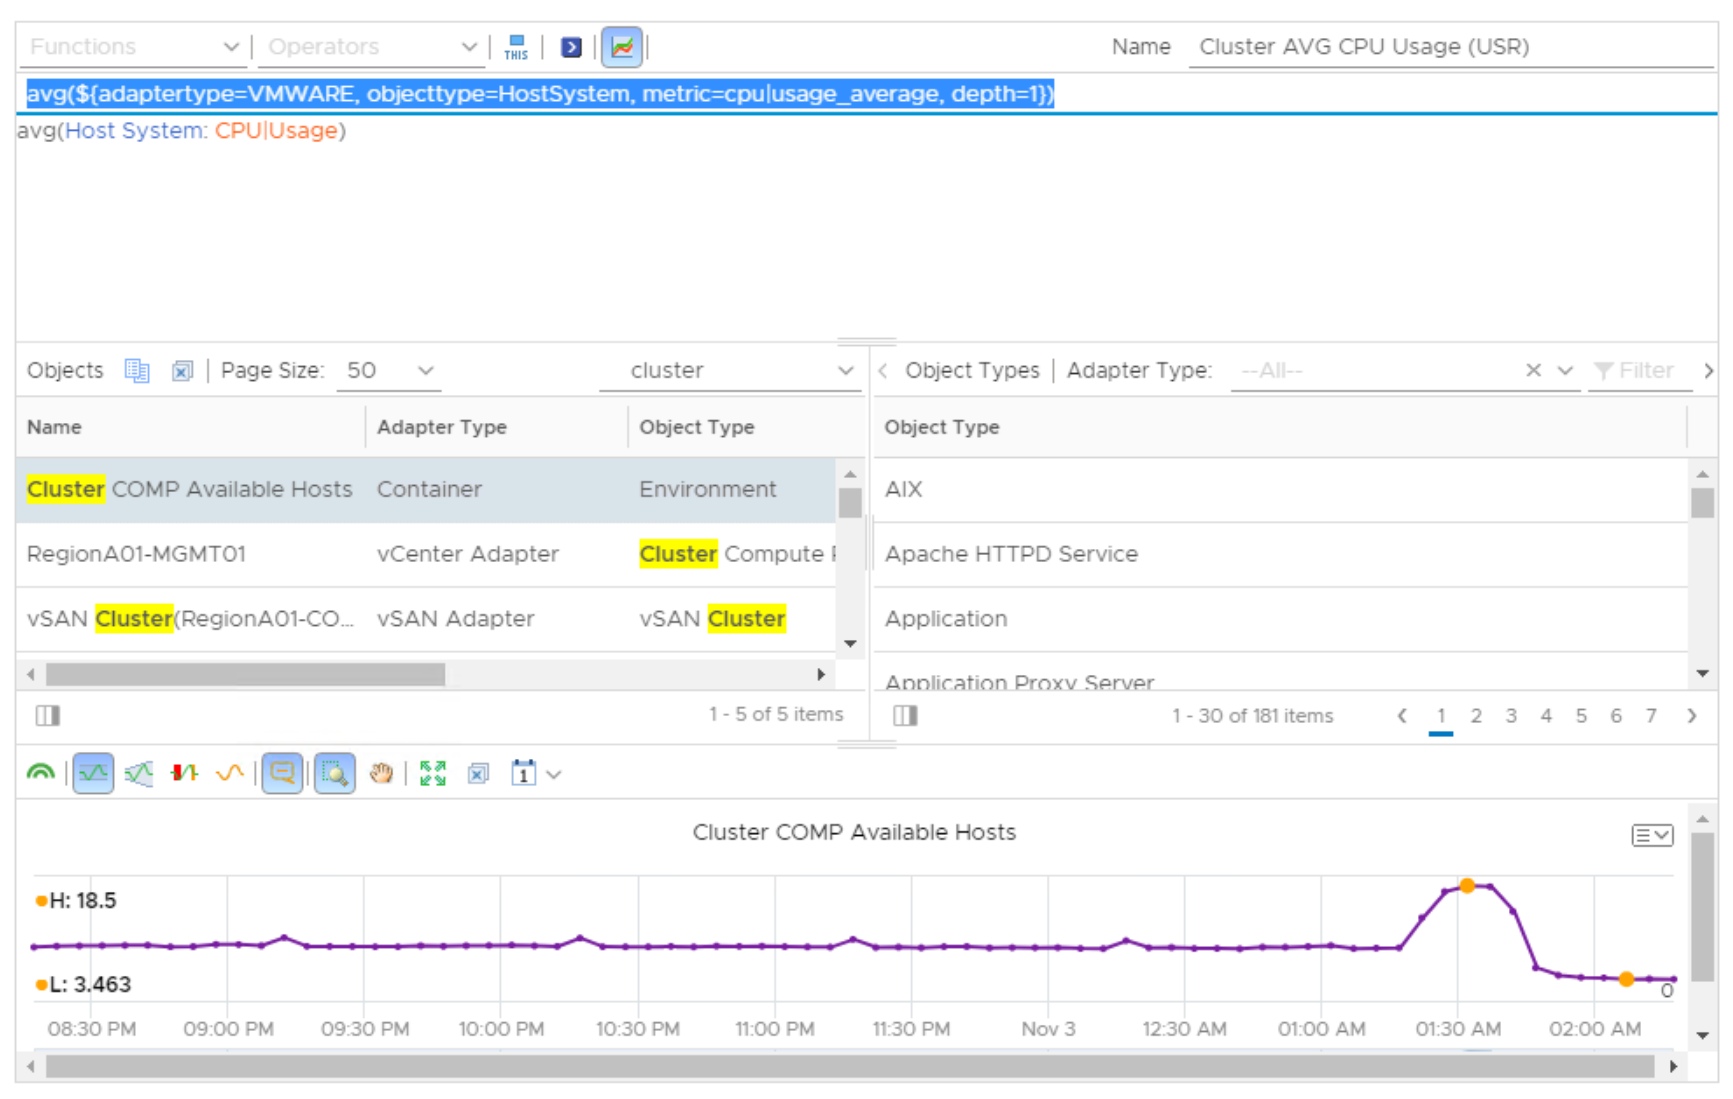
Let’s first create a Super Metric. In this example let’s say I want to calculate the average CPU usage per cluster, so I will build a Super Metric to do so.
Using the cpu|usage_average metric my formula would look like this:
avg(${adaptertype=VMWARE, objecttype=HostSystem, metric=cpu|usage_average, depth=1})
When I associate these metrics to the Cluster Compute Resource object time it will give me the average CPU usage for a vCenter Cluster. This will include though hosts in Maintenance Mode and disconnected hosts.
For the purpose of this example, I have 4 hosts. One of them is in Maintenance Mode and one is Powered Off

Just to make sure my formula is returning correct results I can switch the avg function with a count function and check the number of hosts returned like this:
count(${adaptertype=VMWARE, objecttype=HostSystem, metric=cpu|usage_average, depth=1})
This gives me a count of 4 (hosts). As we said our formula still doesn’t account for hosts in Maintenance Mode and Powered Off hosts, so this is correct.
So let’s refine this further.
The where clause verifies whether a particular metric value can be used in the super metric. Use this
clause to point to a different metric of the same object. We can use the where clause to filter only hosts in Maintenance Mode using the Runtime|MaintenanceState property. As we said before vROps 6.7 introduced a lot of new operators that one can use in Super Metrics. vROps adds even more. New addition includes the following equality operators for the where clause:
| Operators | Function |
| equals | Equals |
| !equals | Does NOT equal |
| startsWith | Starts with |
| !startsWith | Does NOT start with |
| endsWith | Ends with |
| !endsWith | Does NOT end with |
NOTE: The equality operators can only evaluate string types
Using the equals equality operator our formula will look like this:
avg(${adaptertype=VMWARE, objecttype=HostSystem, metric=cpu|usage_average, depth=1, where = "Runtime|MaintenanceState equals notInMaintenance"})
Again if I switch the avg for a count function I can see that now my formula calculates results based on 3 hosts and it is excluding the host in Maintenance Mode

Unfortunately, there is no way in vROPS to combine multiple where clauses within the same function.
Which means we CANNOT do something like
avg(${adaptertype=VMWARE, objecttype=HostSystem, metric=MyMETRIC, depth=1, where = "MyCONDITION1" && where = "MyCONDITION2"})So to achieve our goal we will look into Custom Object Groups in vROps. vROps offers the following constructs which allow us to logically group or filter objects:
- Tags
- Application Groups
- Custom Object Groups
Tags and application groups are used to logically organize similar objects, for example, by application, by organization, or by location.
A custom object group is a container that can hold any number of objects and any type of object.
Using custom object groups, you can align infrastructure operations with business teams and priorities:
- Line of business
- Workload type
- Configuration type
For more about the grouping/filtering constructs, you can check the book, Mastering vRealize Operations Manager – 2nd Edition
Now let’s create a new custom group and see how we can filter the hosts and get the results we need.
For our custom group I will specify three membership criteria:
- Based on the Runtime|Maintenance State property to filter hosts that are in Maintenance Mode.
- Based on the System|Powered On metric to filter powered off hosts.
- Based on Relationship child off criteria to filter hosts belonging to my COMP cluster for which I want to calculate the super metric.
I also want this group to be dynamically populated and updated so I have checked the “Keep group membership up to date” option.

Previewing the custom group results I can see that I get the desired results. I can see only 2 hosts , filtering 1 host in Maintenance mode and 1 host that is powered off.

Now, let’s go back to our super metric and test it again. Our formula will not contain anywhere statements as we are doing the filtering on a custom group level:
avg(${adaptertype=VMWARE, objecttype=HostSystem, metric=cpu|usage_average, depth=1})Applying the formula on the custom group (Cluster COMP Available Hosts) container we created earlier yells correct results.
To verify again we can switch avg for count function and check the number of hosts included in the calculation. The result is 2 hosts which is correct:

For more articles like this, visit www.kaloferov.com


